Image Statistics
A typical use of the image statistics tool is to determine the readout
noise in the camera electronics. This is done by looking at the
distribution of pixel intensities for an image taken in complete
darkness, with the camera cooled and at very short integration time (to
further minimize thermal count). In this case, there should be no
spatial correlation of pixel intensities between images so that the
noise is entirely from the CCD readout chain. Ideally, a
histogram of the pixel intensities should be a Gaussian distribution,
with the half-width of the Gaussian representing the RMS readout noise
in ADU. If the camera gain is known (nominally, it is about 1.72
electrons/ADU for a KAF401e, Pyxis camera) then the readout noise in
electrons can be determined. The camera gain can be determined
using the process described in "Measuring
the transfer constant".
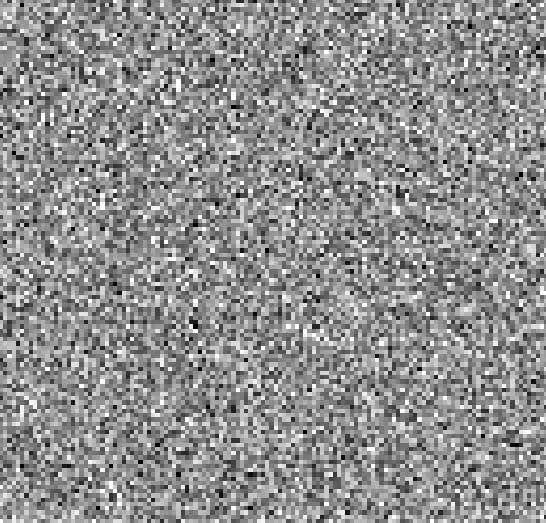
The image below is an example of what a portion of typical Pyxis dark
frame should look like. There is no spatial pattern visible in
the image and the distribution of pixel intensities about the offset
level (~6000 ADU) is random.
Statistics for part of an image frame can be obtained by clicking and
dragging a selection rectangle on the image, right-clicking to open the
image tools menu, and selecting "show stats for selected".
Alternatively, the image statistics icon can be clicked on the
toolbar. Here is what was obtained when the statistics form was
opened after most of the above image was selected for computation,
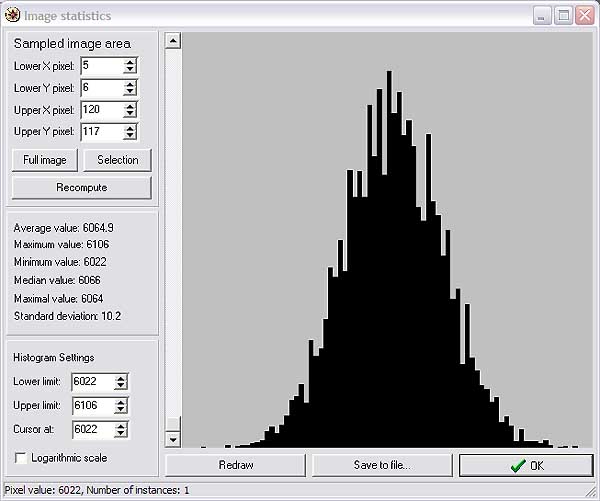
The standard deviation is approximately 10 ADU (17.5 electrons), which
is about as good as the Pyxis camera gets using the KAF401e chip.
Note that the shape of the distribution is approximately
Gaussian. If any skew to the left or right were visible, this
might indicate that the CCD was not sufficiently cooled so that a
gradient due to the thermal count was present in the image. The
frequency of occurrence of a particular pixel value can be displayed by
moving the mouse over the histogram, or forcing the logical "cursor" to
a specific pixel value in the histogram (change the "Cursor at: "
value). The histogram upper and lower pixel value limits can be
changed so that one can zoom in on a particular region of the
histogram. The slider bar on the left of the histogram is
used to change the vertical display scale of the histogram. "Save
to file" opens a dialog to save the statistical information as a comma
delimited text file that can be imported into a spreadsheet.