
Least-Squares Deconvolution or LSD
is a new cross-correlation technique for computing
average profiles from thousands of
spectral lines
simultaneously. Under several
rough approximations (additive line profiles, wavelength independent limb-darkening,
self-similar local profile shape, weak magnetic fields), unpolarised/polarised
stellar spectra can indeed be seen as a line pattern convolved
with an average line profile. In this context, extracting this average
line profile amounts to a linear deconvolution problem. We treat it as a
matrix problem and look for the
least-squares solution. In practice, LSD is very similar to most other
cross-correlation
techniques, though slightly more sophisticated in the sense that it cleans the
cross-correlation profile from the autocorrelation profile of the line pattern.
LSD is particularly well suited for measuring line profile Zeeman signatures generated by magnetic fields at the surfaces of stars through the Zeeman effect. In rapidly rotating cool active stars for instance, circularly polarised (Stokes V) signatures of line profiles are very small (with a typical amplitude of about 0.1% peak-to-peak); they are in particular smaller than photon noise for the vast majority of spectral lines and stellar targets (even on the biggest telescopes), exposure times being limited to no more than a few % of the rotational cycle. Linearly polarised (Stokes Q and U) signatures of magnetic chemically peculiar stars are just as small and difficult to measure. All assumptions inherent to LSD are found to be verified at noise level accuracy in this particular context.
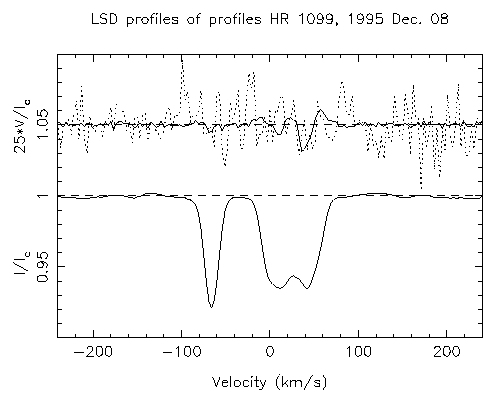
LSD extracts line profile polarisation information from thousands of spectral lines simultaneously. Below is an example in the particular case of the RS CVn system HR 1099 (K1 subgiant and G5 dwarf). The LSD Stokes V profile (upper curve, full line) clearly indicates a Zeeman signature, in conjunction with the broad LSD unpolarised spectral line of the K1 subgiant (lower curve). This signature could not have been detected when averaging together no more than a few unblended spectral lines (upper curve, dotted line).
 © MNRAS
Monitoring such Zeeman signatures throughout a complete rotational cycle allows
one for instance to map the details of the associated
stellar surface magnetic topology.
Surprisingly enough, LSD is also found to work remarkably well when applied to unpolarised (Stokes I) spectra, even though assumptions inherent to LSD are clearly not verified at noise level accuracy (except for very weakly exposed stellar spectra). In particular, we observe that LSD yields very clean average Stokes I profiles with a flat continuum and a considerably enhanced signal to noise ratio independently of stellar rotation rate.
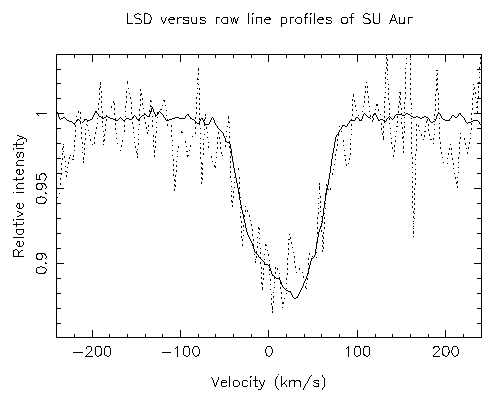
Below is an example of how much LSD can enhance spectrum quality, in the particular case of a weakly exposed spectrum of the classical T Tauri star SU Aur (signal to noise ratio peaking at about 55 in the red). The signal to noise ratio in the LSD Stokes I profile (full line) is at least 8 larger than in any individual photospheric feature of the original spectrum (the dotted line illustrates the particular case of the strong Ca I line @ 643.9075 nm), with no loss of spectral resolution. One obvious advantage of LSD is therefore to detect profile distortions due to surface brightness inhomogeneities in faint and/or rapidly rotating stars with a much higher accuracy.

Among all other possible applications, one can mention accurate chemical abundance
determination, as well as precise radial or rotational velocity measurements on stars
too faint or rotating too rapidly to be studied with more conventional methods.
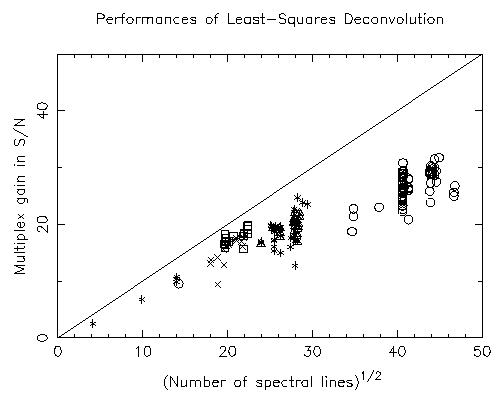
As one can see from the graph below (obtained from spectropolarimetric data recorded at the Anglo-Australian Telescope), we find that the multiplex gain in signal to noise ratio associated with LSD increases roughly with the square root of the number of spectral lines used and can be as large as a factor of 32 in the particular case of a K1 star. This amounts to a sensitivity increase of 7.5 mag, at no cost other than using an echelle spectrograph that can collect 250 nm in a single exposure.
 © MNRAS
 Shorlin S.L.S, Wade G.A., Donati J.-F., Landstreet J.D.,
Petit P., Sigut T.A.A., Strasser S.,
``A sensitive search for magnetic fields in
B, A and F stars'' (2002) A&A 392, 637
 Donati J.-F., Mengel M., Carter B.D., Cameron A.C., Wichmann R.,
``Surface differential rotation and prominences
of the Lupus post T Tauri star RX J1508.6-4423'' (2000) MNRAS 316, 699
 Barnes J.R., Cameron A.C., James D.J., Donati J.-F.,
``Doppler images from dual-site observations of
southern rapidly rotating stars I: differential rotation on PZ Tel''
(2000) MNRAS 314, 162
 Wade G.A., Donati J.-F., Landstreet J.D., Shorlin S.L.S.,
``Spectropolarimetric measurements of
magnetic Ap and Bp stars in all four Stokes parameters'' (1999) MNRAS
313, 823
 Wade G.A., Donati J.-F., Landstreet J.D., Shorlin S.L.S.,
``High precision magnetic field
measurements of Ap and Bp stars'' (1999) MNRAS 313, 851
 Donati J.-F.,
``Magnetic cycles of HR 1099 and LQ Hydrae''
(1999) MNRAS 302, 457
 Donati J.-F., Cameron A.C., Hussain G.A.J., Semel M.,
``Magnetic topology and prominence patterns on
AB Doradus''
(1999) MNRAS 302, 437
 Barnes J.R., Cameron A.C., Unruh Y.C., Donati J.-F., Hussain G.A.J.,
``Latitude distributions and lifetimes of starspots
on G dwarfs in the Alpha Persei cluster''
(1998) MNRAS 299, 904
 Donati J.-F., Cameron A.C.,
``Differential rotation and magnetic polarity patterns
on AB Doradus''
(1997) MNRAS 291, 1
 Donati J.-F., Semel M., Carter B.D., Rees D.E., Cameron A.C.,
``Spectropolarimetric observations of active stars''
(1997) MNRAS 291, 658