| Creating the Master Detrend Data |
|
One of the largest advantages of Elixir is our ability to use all of the data from a given CFH12K run to produce high-quality detrend data. The use of input detrend data from an entire run improves the statistics of the measurement, and it gives us more opportunities to detect variations in the input images during the run or reject specific images which have poor data quality for any of a variety of reasons. Detrend DataThe process of master detrend image creation is fundamentally different from the process of analysing individual science images. Instead of performing a complex series of tasks on a single image, a relatively simple task is performed on a large number of images simultaneously. The largest difficulty in detrend creation is ensuring the quality of the input images and selecting only the good images. We will discuss the important aspects of each type of detrend data. For reference, we will briefly discuss the different types of detrend data and their impact on the science image. The detrended science image is derived from the raw image by applying a function such as: S = (R - C1) * C2 - C3
where R is the raw image and S is the resulting detrended science
image. For a linear detector, there can only additive and
multiplicative terms, Biases & DarksBiases & darks are the easiest type of detrend data to handle and to create effectively. For most detectors, reasonably good accuracy can be achieved by using the bias determined from the overscan portion of the chip. CFH12K is typical in this sense and has only minor dark current (~ 0.01 cts / sec median). Nonetheless, there are some pixels with significant dark current that, if corrected appropriately, can improve the accuracy of the detrended science image. Therefore, for the best possible detrending it is necessary to produce a high quality dark frame. In this discussion, we will treat bias and dark frames identically; bias frames are really dark frames of 0 seconds. We have found that for CFH12K, it is possible to scale a dark of a specific exposure time to create the necessary dark of a different exposure time - the dark current is repeatable (see report by JCC). The scaling factor is not simply linear, but is well approximated by a 2nd order polynomial. Therefore it is not necessary to maintain a set of darks for all exposure times used, but only for a subset spanning the typical range of exposure times. It is useful to have a well-sampled collection of exposure times to avoid scaling by too large of a factor. For the QSO process, we have defined a set of dark exposure times, and all darks obtained by QSO fall in one of these bins. This simplifies the data handling for both QSO and Elixir; we only need to analyse and record a limited number of dark frames. We have also found that the dark structures do not change significantly with time, now that the CCDs have been temperature regulated. Therefore, it is not necessary to take darks frames many times during the CFH12k run. The QSO team therefore inserts a dark & bias block during one of the days when the day crew is not scheduled. We try to obtain two complete sets, one near the beginning of the run, one near the end. These can be compared to the past darks & biases to ensure there have been no systemic changes. FlatsThere are three typical ways to create a flat field image: twilight flats, median night sky flats, and dome flats. At the level of greatest detail, there can be significant differences between these three. Each choice has advantages and disadvantages. Ideally, we would illuminate the detector with a spatially uniform light source having the same spectrum as the objects of interest. The latter requirement is impossible because we are imaging a variety of stars with a range of spectra, while the former requirement can be difficult to achieve in practice. The spatial uniformity of the source can be compromised in several ways. For dome flats, it is typical that the illumination on the screen or dome surface is not uniform. For twilight flats, with a detector as large as 12k, it is possible for clouds or haze to cause spatial patterns or gradients. For median night sky flats, the presence of bright stars, galaxies, or other real sky features can cause spatial non-uniformity, as can unseen clouds or haze. Even if the source is uniform, the detector may be non-uniformly illuminated if there is significant scattered light. Scattered light can be difficult to detect and eliminate in a large system like 12k. All three of the flat-field techniques may be succeptible to scattered light, although the pattern or fraction of scattered light may differe for the different techniques. Finally, the spectral shape of the light source can be particularly challenging. Since most objects have spectral shapes which are semi-thermal (ie, stars, with a range of temperatures and absorption lines), we are best using a source with a similar shape. Careful choice of the lamp used in dome flats can result in a fairly featureless spectrum. Twilight flats may have spectral lines from the atmosphere, especially towards the dark end of twilight. At Mauna Kea, the occasional volcanic haze may also be a source of emission lines. The night sky spectrum is strongly dominated by airglow lines, especially in the region redwards of about 7000 Å. There are clearly strengths and weaknesses for each of these flat-field sources. The stability and guaranteed nature of the dome flats makes these particularly tempting, but to date, the challenges involved in removing the spatial non-uniformities of the source have prevented us from making full use of dome flats. Currently, we choose the twilight flats, because they have the best combination of uniform source and appropriate spectrum. However, the conditions during the twilight flat acquisition are not easily controlled. To make the best flats, it is important to know the conditions of the sky for each of the input images, and exclude those taken under cloudy or cirrus conditions. We have been carefully recording the appearance of the sky for each twilight period, and we have found it is possible to robustly reject twilight flats taken in sub-optimal conditions on the basis of their residual appearance. Fringe Frames & the `Sky Ring'Fringe frames are necessary to remove the fringe pattern seen in red images, particularly I & z'. The fringes are caused by varying efficiency of the detector to nearly monochromatic light. At longer wavelengths, thinned chips act like a thin film and become susceptible to the effects of interference as the light passes through the silicon. For a light of a given wavelength, the observed fringe pattern is very stable, being determined by the thickness of the chip at each pixel. The effect is not very strong for continuum sources, for which the fringe pattern is smeared out. Flat-field images, generated with the nearly-continuum spectrum of the twilight sky, correct for the sensitivity variations to which stars are susceptible. The remaining fringe pattern seen in flatten night-time images is the result of a few strong atmospheric emission lines. Since it is caused by the sky, and not inherent in the sensitivity of the detector to the stellar flux, the fringe pattern should be treated as an additive term remaining after the flat-fielding. We have found that the fringe pattern is quite stable over time, but the strength of the pattern relative to the sky brightness varies substantially. To generate a master fringe frame, it is necessary to obtain many images with significant sky flux, taken at different locations on the sky, and without excessively large structures in the images, either large galaxies, nebulae, or very bright stars. These images are flattened before they can be combined. The strength of the fringe pattern in each image is determined by examining the distribution of flux at specific locations for each chip. The input frames are the scaled to a common fringe strength, and median-combined. The resulting fringe frame can be applied to a flattened science image in much the same way. The strength of the fringe pattern is determined for the image using the same method above. The master fringe frame is scaled to match the science fringe strength before being subtracted from the science image. The true fringe pattern is detectable in I and Z' images, but there is a similar type of effect in R. In R, flattened images show an axisymmetric pattern on the scale of the mosaic. This pattern is bright on the edges of the detector and dark toward the center, and essentially only a large-scale structure. We have called it the `sky ring'. The origin of the `sky ring' is not entirely certain. The most likely suggestion is that it is caused by a variation in the apparent bandpass of the filter to light at different angles. There are certain strong atmospheric emission lines near the RED? end of the R band-pass. The sky-ring may be caused by the filter admitting more or less of this emission line. Since it is an additive term, the sky ring can be corrected with essentially the same process as for the fringe pattern. Creation of detrend dataThe Elixir detrend creation system is one of the most complex components in the entire collection of Elixir software. There are several stages to the detrend creation, and unlike most Elixir analyses, the process involves some human interaction and manual selections. In fact, the creation of the first-order detrend products, the bias, dark, and flat-field images, is separated from the process of creating the fringe frames. The creation of high-quality fringe frames depends on the prior existence of the other detrend types so that the input images can be detrended before they are merged. In this document, we first discuss the process which creates the first-order detrend products (mkdetrend), and later the process to create the fringe frames.
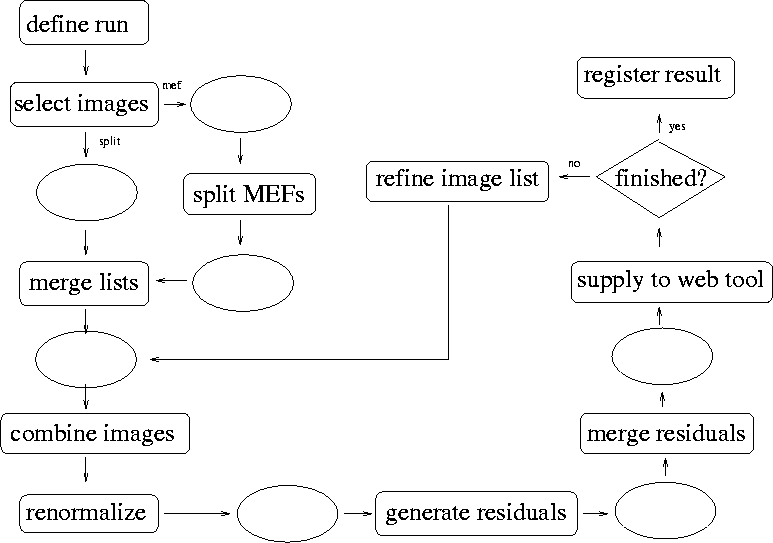
The detrend creation process can be separated into several distinct stages, outlined in the flow-chart in Figure 1. The basic steps consist of: selection of the input detrend images of the appropriate type, creation of a master detrend image from this set, evaluation of the residuals for each of the input images, and rejection of the poor input images as needed. A new master is recreated and the evaluation repeated until the residuals are satisfactory. Finally, when an appropriate detrend image has been created, it is registered in the detrend database and saved for future use. Definition of the detrend imagesThe first step involves the definition of a set of selection criteria for the input detrend images, and the initial processing of those images. The selection criteria define the detrend images to be created. These criteria include the detrend type (ie: flat, dark), the valid time range for these detrend images, and a filter of some sort. In the case of flat-field images or additive corrections such as fringe frames, the filter refers simply to the filter used on the telescope. In the case of dark images, the `filter' refers to a particular exposure time: dark images are created using a set of input images of the same exposure time. We construct a name for the resulting data products based on these input criteria. The time range is converted to the name of the appropriate CFH12K run, the period of time that the camera is mounted on the telescope. The CFH12K runs have names of the form 01Ak01, where the first two digits give the year, the first letter (A/B) defines the semester, the next letter (k) is used to define the instrument (CFH12K), and the following two digits defines the run number within the semester. The mkdetrend data products are given names which start with this Camera run word, followed by the detrend type, the filter, and a version number as needed. The data products which are specific to a single CCD also include the CCD number before the version number. For example, the first version of a B flat-field image created for chip 03 for the first CFH12K run in semester 2001A has the name 01Ak01.flat.B.03.00.fits. Similarly, the associated dark of 300 seconds would be 01Ak01.dark.300.03.00.fits. Once the selection criteria are defined, mkdetrend selects the appropriate input images for each set of selection criteria. The selection is made by searching the Imreg database for images that match the detrend type, the filter, the time range, etc. The selected set of input images are then checked for problems which may be identified from the information in the Imreg database, such as saturation in the flats, or twilight flats taken at impossible times (ie, not really twilight flats, but mis-named). Also, if for any reason a mosaic image is missing one or more CCDs, the complete mosaic is reject. It is necessary for the combination of the detrend images to have an identical collection for each CCD. Once the final set of images has been created, those images which are in MEF format are split for ease of manipulation in the later stages. At this stage, mkdetrend also creates a set of image lists for each configuration which will be used to guide the rest of the analysis stages. Creation of master detrend imagesThe next major stage involves the creation of master detrend images on the basis of the collection of selected input images. In practice this process is divided into three sub-stages to simplify the parallel processing. The first step involves the creation of master detrend frames from each of the lists of input images independently by CCD. The processing is performed by a component in the Flips analysis system, imcombred, which combines images using the mean, median, or minimum, with the possibility for options such as sigma clipping, etc. Imcombred also is aware of the different needs for processing bias, dark, and flat-field images, such as whether to subtract an overscan region, etc. This is the most time-consuming step in the mkdetrend process. Since each CCD is processed independently, these operations can be run in parallel by CCD. The resulting images are not normalized, but instead are set to retain the average pixel mode for the collection of input images. This ensures that, for example, the different flat-field CCD images for a mosaic retain the appropriate relative scaling. Applying such a flat-field set of CCDs would flatten the entire mosaic to a uniform level across all CCDs. However, the resulting image would also have an arbitrary flux level. It is therefore necessary to re-normalize the set of flat-field images so that science images maintain the original count level. For CFH12K data, we normalized all flat-field images so that the mode of Chip 04 has a value of 1.0. It is very important that this re-normalization be done in a consistent way for all data obtained with the mosaic. Since each chip has a different quantum efficiency and gain, the choice of a specific chip as a reference determines the zero point for the images. Choosing chip 09, for example, would rescale our flat-field image by a factor of 1.17 and shift the resulting zero point by 0.17 mag. The second step in the creation of the master detrend images therefore uses the reference CCD (04) to renormalize all of the CCDs in the mosaic. This is also the stage at which external information about the detrend data, such as the valid time range, can be written to the image headers. This processing can still be done in parallel on a CCD-by-CCD basis, but it must be done after the previous step, the master creation, is finished for all CCDs. The images which are written to disk are saved as 16 bit FITS images, with BZERO and BSCALE set to maintain the appropriate dynamic range. Since the normalization is different for the flats from the darks & biases, these two types have different values of BZERO & BSCALE. For the darks & biases, the dynamic range is essentially the same as for the raw CCD data: 0 - 64k. We therefore maintain the standard BZERO & BSCALE values used for 16 bit unsigned data: 32768 (215) and 0. For the flats, the dynamic range is very different. All reasonable data values are between 0.2 and 5.0. Anything larger than a factor of 5 correction will introduce substantial noise and probably is invalid in any case. However, the flat-field image should not introduce bit noise at a level which is significant compared to the 1% photometric accuracy. We therefore choose BZERO and BSCALE to be 3.2 and 0.0001. This ensures that the 16 bit data lies within the range 0.0 - 6.4, with a bit resolution of 0.0001. At this stage, the resulting master detrend image is also applied to each of the input images and an image of the residuals for each input image is created. These residual images are saved in two forms: First there is a bin-by-10 image, where each pixel is represented by the average of the 100 pixels in the original image. Second, there is a very small median thumbnail in which each pixel is the median of a 100x100 pixel region in the original. Both types of images are saved to disk as FITS images. In addition, as the residual images are generated, a variety of statistics and other data about the residual images are saved. These include the mean, median and standard deviation of pixel values in the residual images. We also clip the images to exclude outliers and re-calculate the mean, median, and standard deviation. The clipping which is applied is different for bias & dark from flat-field images since the appropriate dynamic range is different for the two types of images. Finally, we calculate the mean, median, and standard deviation for the median thumbnail image. The third step in the master image creation is performed in parallel by mosaic, not by CCD. In this step, the data relevant to each CCD is gathered together for the entire mosaic. The various statistics listed above are combined for the 12 detectors to determine the same collection of statistics for the mosaic as a whole. The FITS residual images for each CCD are mosaiced together to form a single image for the entire mosaic. This image is then converted to a grey-scale jpeg so it can be viewed in the HTML-based tool discussed below. Scaling for these images is set to emphasize the residual in the range of interest. For the darks & biases, the full range of the greyscale is mapped to pixel values of -10 to +10. For the flats, the full range of the greyscale is mapped to pixel values of -0.5% to +0.5%. These tight ranges mean that any residuals which are unacceptable are easily visible in the jpeg images. Evaluation of the master detrend imagesOnce master detrend images have been created, and the summary data about the residuals has been generated, it is necessary for a person to make some intelligent selection of the input images. The previous steps are performed by running a single program, mkdetrend, and can be completely automated. The evaluation step is performed by viewing a web-based set of reports, and selecting or rejecting images as needed. At this point, the mkdetrend operator may view the residual images and statistics for each of the detrend configurations. The operator may choose to exclude specific input images if their residuals are excessively poor, or they may decide to split a configuration into multiple versions, and define different date ranges for the new versions. This latter option is necessary if the detrend data changes significantly during the camera run, for example, if a large dust grain lands on one of the filters, or if the electronics are reset to new gains during the run. After making some evaluations, exclusions and selections, the operator may restart the detrend process to the second stage for the subset of the detrend configurations that require reprocessing. The new reprocessing will use only the selected images to generate a new master detrend image, but residuals are generated for each of the input images. Further evaluation may be performed as needed, and the detrend images reprocessed again. Once the operator is satisfied with the results of a given configuration, the master detrend image can be accepted and entered into the detrend database. The intermediate data products can be removed at this time, but the data used to generate the evaluation reports is saved. This data can be used to generate reports for distribution or for future reference. |